Examples
A straight forward example:
import matplotlib.pyplot as plt
import numpy as np
from remedian.remedian import Remedian
# We can have data of any shape ... e.g., 3D:
data_shape = (2,3,4)
# Now we have to decide how many data observations we want to load into
# memory at a time before computing a first intermediate median from it
n_obs = 100
# Pick some example number ... assume we have `t` arrays of shape `data_shape`
# that we want to summarize with Remedian
t = 500
# Initialize the object
r = Remedian(data_shape, n_obs, t)
# Feed it the data ... for now, we just generate the data randomly on the go
# ... also save the actual data for comparison with true median
res = []
for obs_i in range(t):
obs = np.random.random(data_shape)
r.add_obs(obs)
res.append(obs)
# Now we have the Remedian in `r.remedian`
# Let's summarize the results
x = np.median(np.asarray(res).squeeze(), axis=0)
y = r.remedian
xydiff = x-y
# For colorbar scaling
vmin = np.min([x.min(), y.min(), xydiff.min()])
vmax = np.max([x.max(), y.max(), xydiff.max()])
vmin = -1*np.max(np.abs([vmin, vmax]))
vmax = np.max(np.abs([vmin, vmax]))
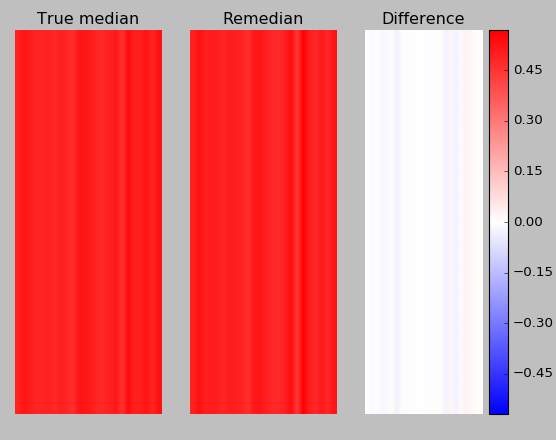
# Plot it
plt.close('all')
plt.subplot(131)
plt.imshow(x.reshape(1,-1), aspect='auto', cmap='bwr', vmin=vmin, vmax=vmax)
plt.axis('off')
plt.title('True median')
plt.subplot(132)
plt.imshow(y.reshape(1,-1), aspect='auto', cmap='bwr', vmin=vmin, vmax=vmax)
plt.axis('off')
plt.title('Remedian')
plt.subplot(133)
plt.imshow(xydiff.reshape(1,-1), aspect='auto', cmap='bwr', vmin=vmin, vmax=vmax)
plt.axis('off')
plt.colorbar()
plt.title('Difference')